Home price appreciation is back to breaking records after a period of declines, pushing homeownership further out of reach for many Americans.
Black Knight’s Home Price Index hit an all-time high in June for both seasonally adjusted and unadjusted levels, up 0.67% from May and 0.8% YOY. This is a serious comeback after 14 straight months of annual declines.
Basically every major American metro saw month-over-month growth explode as demand continues to outstrip supply. In 30 of the country’s 50 largest markets prices have hit new highs.
“We’ve been noting for some months that the recent rate of home price gains would have a lagging, but significant, impact on the annual rate of appreciation. Well, June marked that inflection point……
Annual single-family home prices rose by 19.4% in Q2 2022. This is down from Q1’s upwardly revised 20.5% but still close to a record high, according to Fannie Mae’s latest Home Price Index. On a quarterly basis, home prices increased by 4.3% between Q1 and Q2. “Home prices maintained a near-historic pace of appreciation in the second quarter, as low levels of housing inventory continued to support price growth,” said Doug Duncan, Fannie Mae Senior Vice President and Chief Economist. “At the end of 2021 and extending into 2022, we believe many homebuyers pulled forward their purchase plans to avoid expected increases in mortgage rates, contributing to demand for homes and strong price appreciation. Given the sharp rise in mortgage…
Home prices rose by 20.9% YOY in March, setting another record and marking the 122nd consecutive month of YOY home price increases nationally, according to CoreLogic’s Home Price Index (HPI) and HPI Forecast. Home prices were up 3.3% from the month prior. The annual appreciation of detached properties (22%) was 4% higher than that of attached properties (17.3%). But the company predicts that home price growth will moderate to 5.9% by March 2023 due to rising interest rates and low affordability. Late April rates jumped about 30% YOY, a “trend that might derail more prospective buyers.” “The annual growth in the U.S. index was the largest we have measured in the 45-year history of the CoreLogic Home Price Index,” said…
The Fannie Mae Home Price Index (FNM-HPI) rose to its fastest annual pace ever on record in Q1 2022, measuring 20% YOY, the company reported. This is up from an annualized rate of 19.1% in Q4 2021, the fastest pace in the index’s 47-year history. Seasonally adjusted home prices rose 4.8% from last quarter. The FNM-HPI is a national, repeat-transaction home price index that measures average quarterly price change on all single-family properties in the U.S., excluding condos. The FNM-HPI will now be publicly available as a quarterly series with a start date of Q1 1975. “We’re pleased to begin sharing the Fannie Mae Home Price Index with external audiences. We have long used this index within the company, including…
Home prices rose 17.5% year-over-year in Q4 2021 and 3.3% from Q3 2021, according to the Federal Housing Finance Agency’s House Price Index (FHFA HPI). Home prices were up 1.2% from November to December. Home prices increased in every state between Q4 2020 and Q4 2021, with the highest appreciation in Arizona (27.4%), Utah (27.1%), Idaho (27%), Florida (25.6%), and Tennessee (24.1%). Cape Coral-Fort Myers, FL, saw the greatest annual price increases. The metros with the least annual appreciation were Washington, D.C. (6.6%), Louisiana (10.2%), North Dakota (10.3%), Maryland (10.8%), and Alaska (11.3%). “House prices continued to climb but not as rapidly during the final quarter of 2021 as in earlier quarters,” said William Doerner, Ph.D., Supervisory Economist in FHFA’s…
Home prices across the country rose 1.1% month-over-month in November and 17.5% year-over-year, according to the latest Federal Housing Finance Agency House Price Index (FHFA HPI®). For the nine census divisions, seasonally adjusted monthly house price changes ranged from +0.5 percent in the West North Central division to +1.9 percent in the South Atlantic division. The 12-month changes ranged from +13.3 percent in the West North Central division to +22.8 percent in the Mountain division. “House price levels remained elevated in November, but the data indicate a pivot,” said Will Doerner, Ph.D., Supervisory Economist in FHFA’s Division of Research and Statistics. “The last four months reflect average gains of 1.0 percentage point, down from the larger prior changes during the…
Mortgage loan application volume dropped 2.7% from the week ending December 31, the Mortgage Bankers Association’s (MBA) weekly survey reported. MBA adjusted the results to account for the holidays. The adjusted Market Composite Index, a measure of mortgage loan application volume, fell 2.7%. The adjusted purchase index fell 4%, while the unadjusted purchase index fell 32% and was 12% lower YOY. The refinance index fell 2% and was down 40% YOY. Refinances made up 65.4% of total applications. The survey attributed the drop in refinances to an increase in the 30-year fixed rate, which rose to 3.33%, its highest point since April. “The higher rates to close 2021 caused refinance activity to decrease 2.2%. Refinance demand continues to dwindle, as…
Home prices across the country climbed 18.1% year-over-year (YOY) in November 2021, according to CoreLogic’s Home Price Index (HPI) Report. This is the highest annual growth since at least 1976 when the HPI began. For comparison, the annual growth in November 2020 was 8.1%. Home price growth, which is calculated against the median national home sale price, was up in all four price tiers measured by CoreLogic. The lowest price tier rose 19.8% YOY, while the low- to middle-priced tier rose 19%. Middle- to moderately-priced homes saw an increase of 19.1%, while high-priced homes saw prices rise 18.6%. Arizona saw the highest YOY appreciation (+28.6%), followed by Florida (+25.8%) and Idaho (+25.5%). Washington, D.C., and Alaska were at the bottom…
Home prices rose 1.4% in July, according to the Federal Housing Finance Agency’s House Price Index (FHFA HPI). Year-over-year house prices are up 19.2%. For the nine census divisions, seasonally adjusted monthly house price changes rose 0.8% in the West North Central division and fell 1.9% in the South Atlantic division. The West North Central division saw an increase of 15.6% over the same time the previous year. There was also a 25.6% increase in the Mountain division. “Record appreciation rates for the U.S. continued in July,” said Dr. Lynn Fisher, FHFA’s Deputy Director of the Division of Research and Statistics. “Although the monthly pace of increase slowed in most Census Divisions in July, four areas experienced year over year…
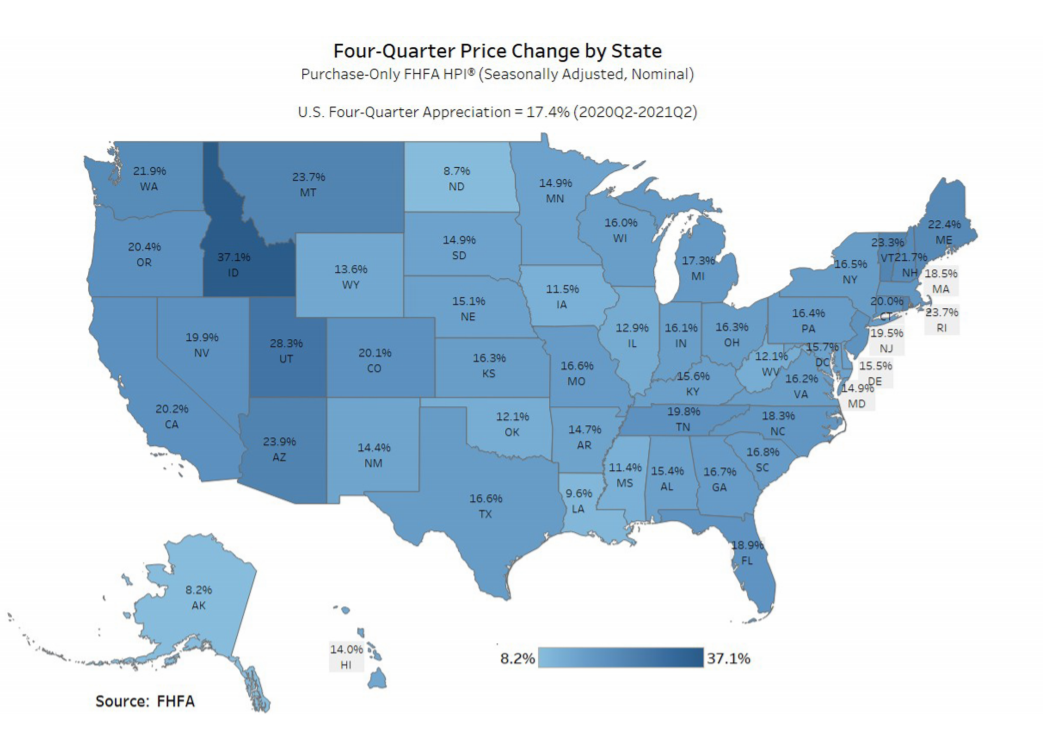
The FHFA’s Q2 House Price Index (HPI) saw its largest ever annual gain, with house prices rising 17.4% year-over-year, up from 12.6% in the last quarter. This surge in home prices breaks the previous record, set in Q1. The FHFA HPI measures the movement of single-family house prices by reviewing repeat mortgage transactions on homes whose mortgages have been purchased or securitized by Fannie Mae or Freddie Mac since January 1975. “During the second quarter, house prices peaked in June with an 18.8 percent growth rate compared to a year ago,” said Dr. Lynn Fisher, Deputy Director of FHFA’s Division of Research and Statistics. “For the quarter, annual gains surpassed 20 percent in the Mountain, New England, and Pacific census divisions and…