The cost of buying a home hit another record high as rising rates intersected with home price growth.
The median U.S. home sale price increased 5% YOY to $380,250 during the four weeks ending April 14. This is just a few grand below June 2022’s all-time high.
At the same time, mortgage rates have jumped up over 7% in recent weeks as inflation data forced the Central Bank to walk back its talk of rate cuts. Some analysts who previously predicted three cuts from the Fed in 2024 now say there may be none at all.
“I think we’re still expecting a couple but clearly we continue to kick the can down the road on rate cuts, and it wouldn’t…
Mortgage applications slipped again as rates stayed put in the high 6%s, keeping affordability at the forefront of buyers’ minds.
The Mortgage Bankers Association’s weekly survey shows that the adjusted Market Composite Index — a measure of mortgage loan application volume — decreased by 0.6%, following the week prior’s 0.7% slip.
Adjusted purchase applications slipped by 0.1%, while the unadjusted index was up 1% and 13% lower YOY.
Rates pulled back slightly, clocking in at 6.91% and the 15-year fixed rate fell to its lowest level in two months, 6.35%. But both are high enough to deter borrowers, according to MBA Vice President and Deputy Chief Economist Joel Kan.
“Elevated mortgage rates continued to weigh down on home buying. Purchase…
“Million-Dollar Cities” took even more share in the U.S. as inventory keeps home prices moving up.
There are 550 cities where the typical home value is $1 million or more, up from 491 last year, according to a new Zillow report.
Home prices were depressed some last year as Americans adjusted to rising rates but have rebounded since the beginning of the year, with many metros clocking new record highs.
Most of these affluent areas are in California, which boasts 210 cities, more than the next five states combined.
New York and New Jersey took second and third place, but the NYC metro area – which includes parts of Jersey and Pennsylvania – would take first for most additions. There…
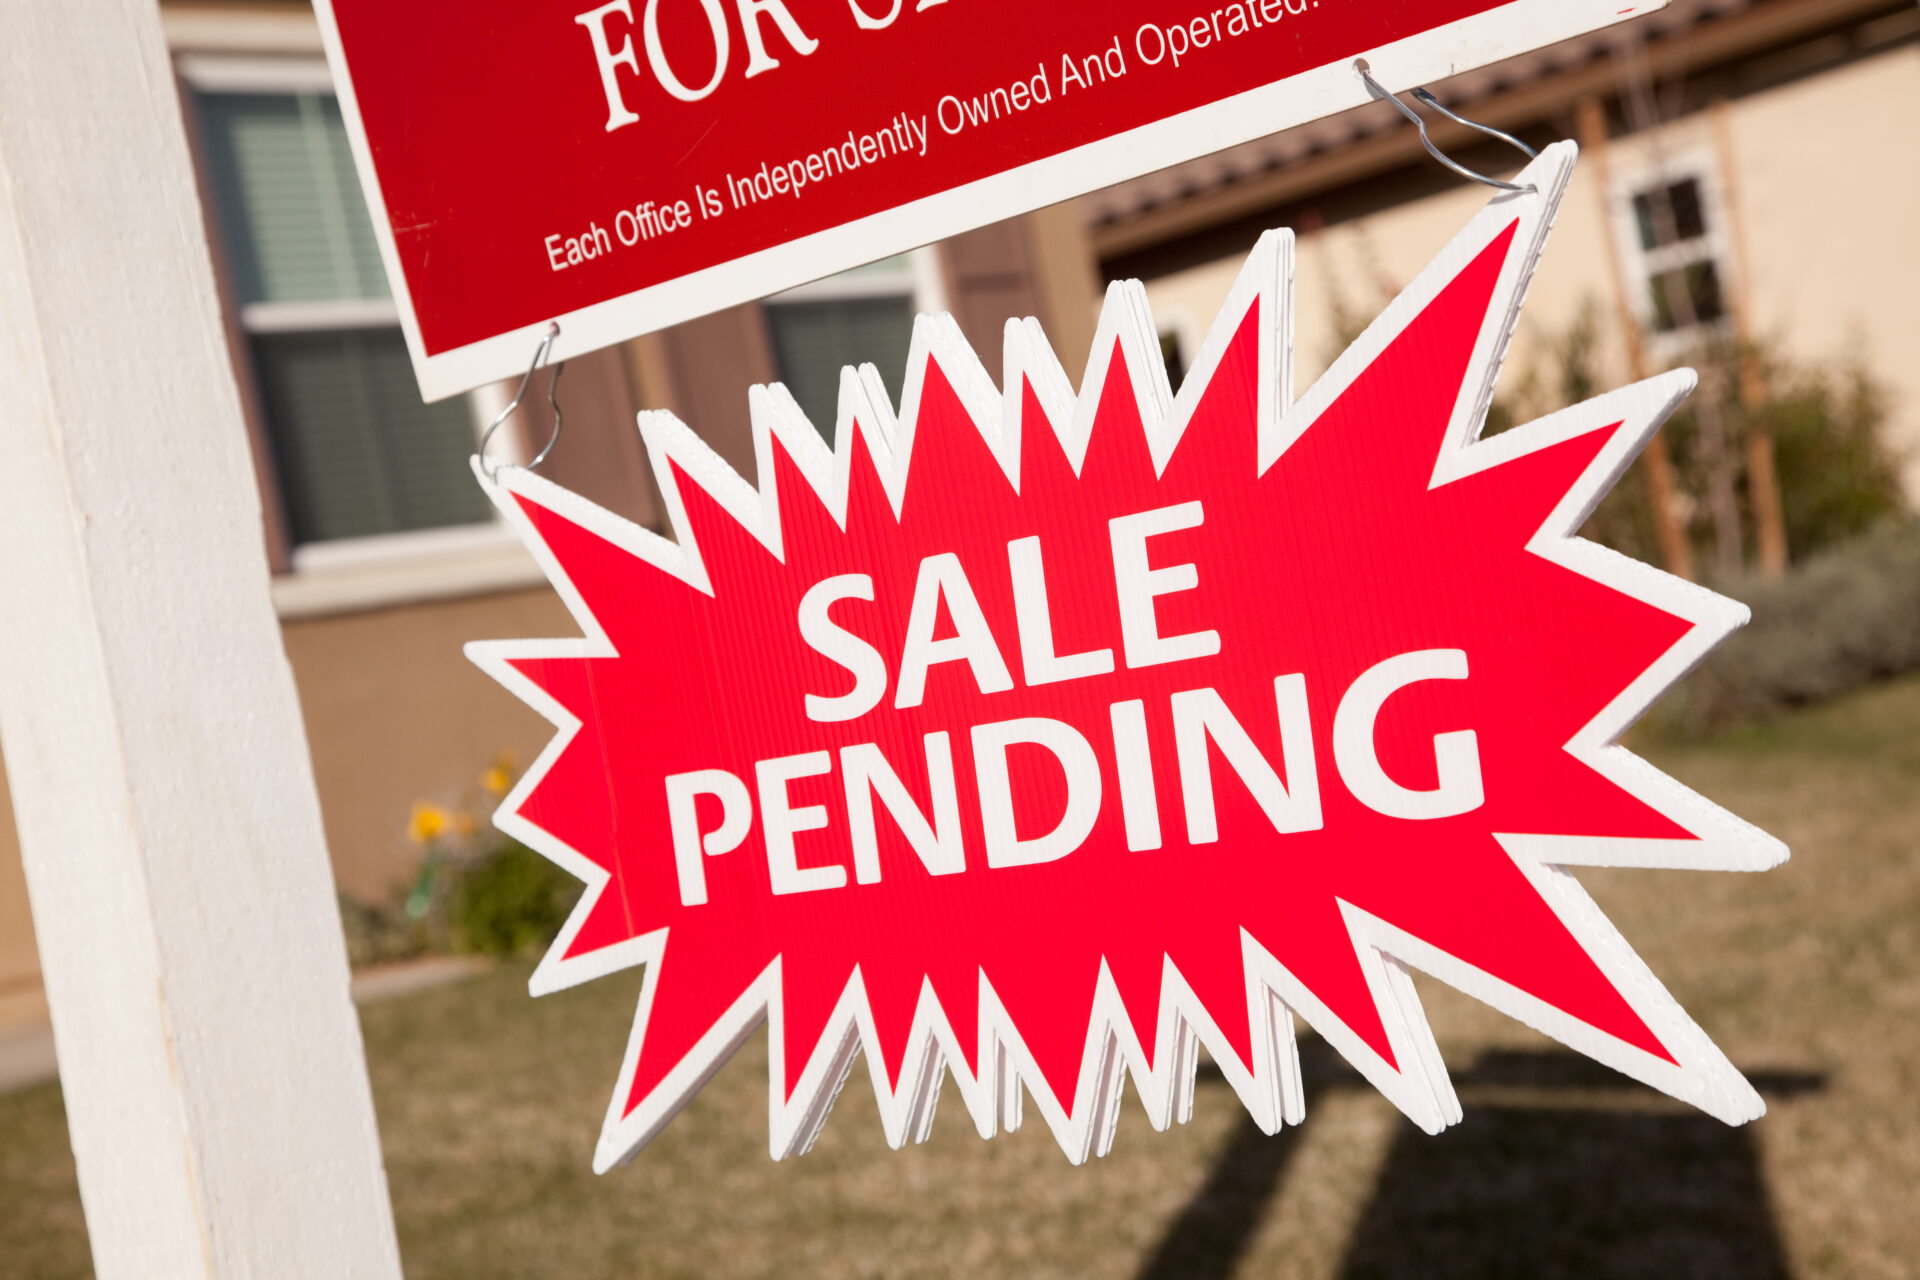
Pending home sales increased in February as inventory loosened up and buyers became accustomed to the high-rate environment.
NAR’s Pending Home Sales Index rose by 1.6% month-over-month to a reading of 75.6 last month. An index of 100 is equal to the level of contract activity in 2001.
Year-over-year, they were down 7%.
“While modest sales growth might not stir excitement, it shows slow and steady progress from the lows of late last year,” said NAR Chief Economist Lawrence Yun. “Ongoing job gains are clearly increasing demand along with more inventory.”
All four U.S. regions saw declines in year-over-year sales, while month-over-month sales rose in the Midwest and South. The Northeast and West saw losses from January.
Southern states and…
Annual home price appreciation continued its upward trend in January, though signs of moderation are shining through on a monthly basis.
Prices were up 6% YOY, an increase from December’s 5.6% gain and the fastest annual rate since 2022, according to the S&P CoreLogic Case-Shiller National Home Price NSA Index.
San Diego once again reported the highest annual gains at 11.2%, followed by Los Angeles with an 8.6% increase. Portland showed a 0.9% increase, the smallest YOY growth.
This is the second straight month of price growth in every city analyzed, putting U.S. home prices at a new all-time high, breaking every record set last year.
“While there is a large disparity between leaders such as San Diego versus laggards…
Home prices slipped in November, breaking a nine-month streak of gains, but were up year-over-year.
Prices were down 0.2% month-over-month from the month prior, according to the S&P CoreLogic Case-Shiller National Home Price NSA Index. This was the first monthly dip since January 2023.
This was partly the result of mortgage rates spiking to peaks of nearly 8% in October 2023, driving demand down and forcing sellers to adjust their profit expectations.
“The house price decline came at a time when mortgage rates peaked, with the average Freddie Mac 30-year fixed rate mortgage nearing 8%, according to Federal Reserve data. The rate has since fallen over 1%, which could support further annual gains in home prices,” Brian D. Luke, Head…
Even as buying a home is getting more expensive by the day, stock shortages are spurring serious competition among the few buyers on the market.
New listings fell nearly 5% last month, according to Zillow’s latest market report. While inventory is slowly recovering – 5% is actually a smaller decline than seasonally expected – it is still the lowest number of listings in any October recorded by Zillow since 2018.
Still, there are good indicators for inventory. Listings were down 1.2% YOY, the smallest since May 2022, and are down 19% compared to pre-pandemic levels, much better than April’s -35%.
In fact, total inventory actually rose 2.6% from September to October, though this was due to a downturn in sales,…
In a year of housing market horrors for buyers, now may be the best time to buy, according to a new analysis from Redfin.
In the last three weeks, rates have sunk from 8% to 7.4%, giving buyers breathing room after a succession of rate increases. Just last week, the 30-year fixed mortgage rate dropped by 25 bps, the largest single-week decline since July 2022.
At the same time, though inventory remains low it is on the rise. New listings were up 1.5% YOY at the beginning of November, only the second stock increase in more than a year.
Plus, with demand slowing as rates priced more buyers out of the market, the number of sellers cutting prices is on…
Mortgage applications tanked last week, hitting their lowest level since 1995 and wiping out a brief surge the week prior.
The Mortgage Bankers Association’s weekly survey shows the adjusted Market Composite Index – a measure of mortgage loan application volume – decreased by 6.9%.
Adjusted purchase applications slipped by 6%, while the unadjusted index fell by 5% from the week before and was 21% lower YOY.
Another week of rate increases drove the decline. The 30-year fixed mortgage rate rose for a sixth straight week to 7.70%, the highest level since 2000.
“Both purchase and refinance applications declined, driven by larger drops for conventional applications. Purchase applications were 21% lower than the same week last year, as homebuying activity continues…
Home prices surged again in the third quarter as home shoppers butted heads because of low inventory.
Annual single-family home price growth increased annually and quarterly from Q3 2022 to Q3 2023, according to Fannie Mae’s Home Price Index.
Price growth rose 2% quarter-over-quarter and was up 5.3% YOY, showing home price appreciation remains resilient amid stock shortages. The index measures the average quarterly price change for all single-family properties in the United States, excluding condos.
“Slightly slowing house price growth may reflect in part the affordability impact of the higher mortgage rate environment – even though prices were still solidly higher this past quarter than a year earlier,” said Doug Duncan, Fannie Mae Senior Vice President and Chief Economist. …