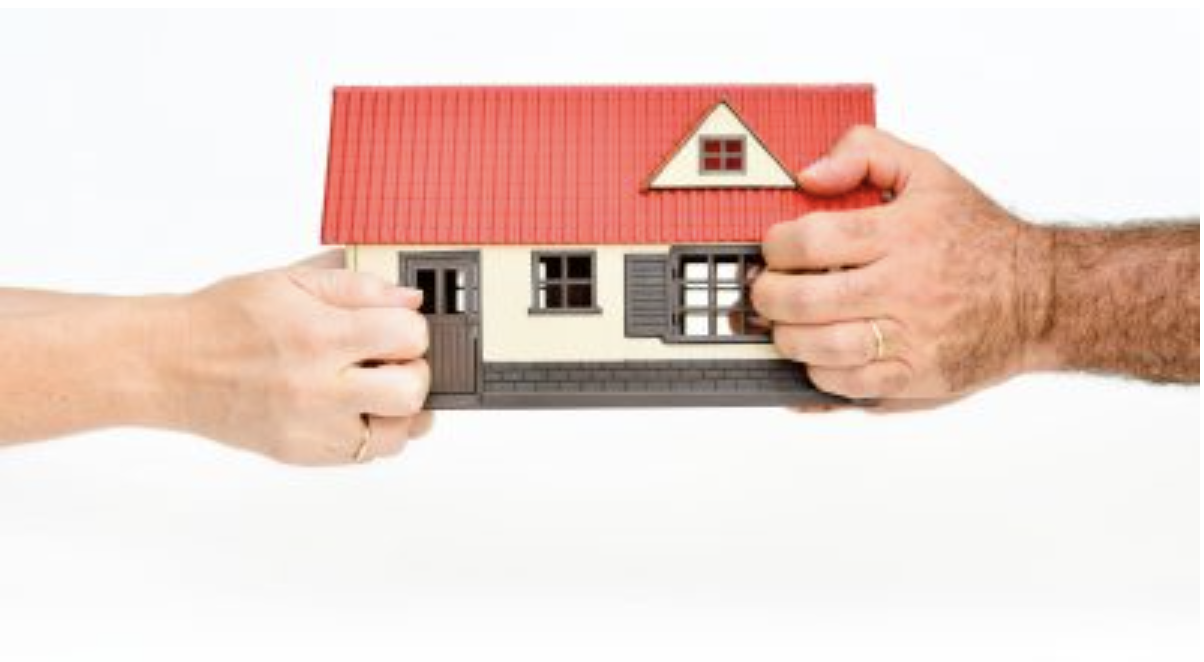
As first-time buyers struggle to find an affordable home, many Millennials say they are willing to co-buy in order to access bigger mortgages. Pairadime, a new fractional ownership solution with a focus on co-buying, surveyed 1,000 Millennials who say they don’t want to wait for marriage to co-buy a home. Instead, they want to co-buy with their parents, friends, or other family members in order to afford a house in current market conditions. Only 4% of respondents said they would wait until marriage to buy with another person. “During the pandemic, people have been renting and they may have wanted more space, and so they looked at, perhaps, their roommate and decided, ‘Let’s go buy a home together,'” Jessica Lautz,…
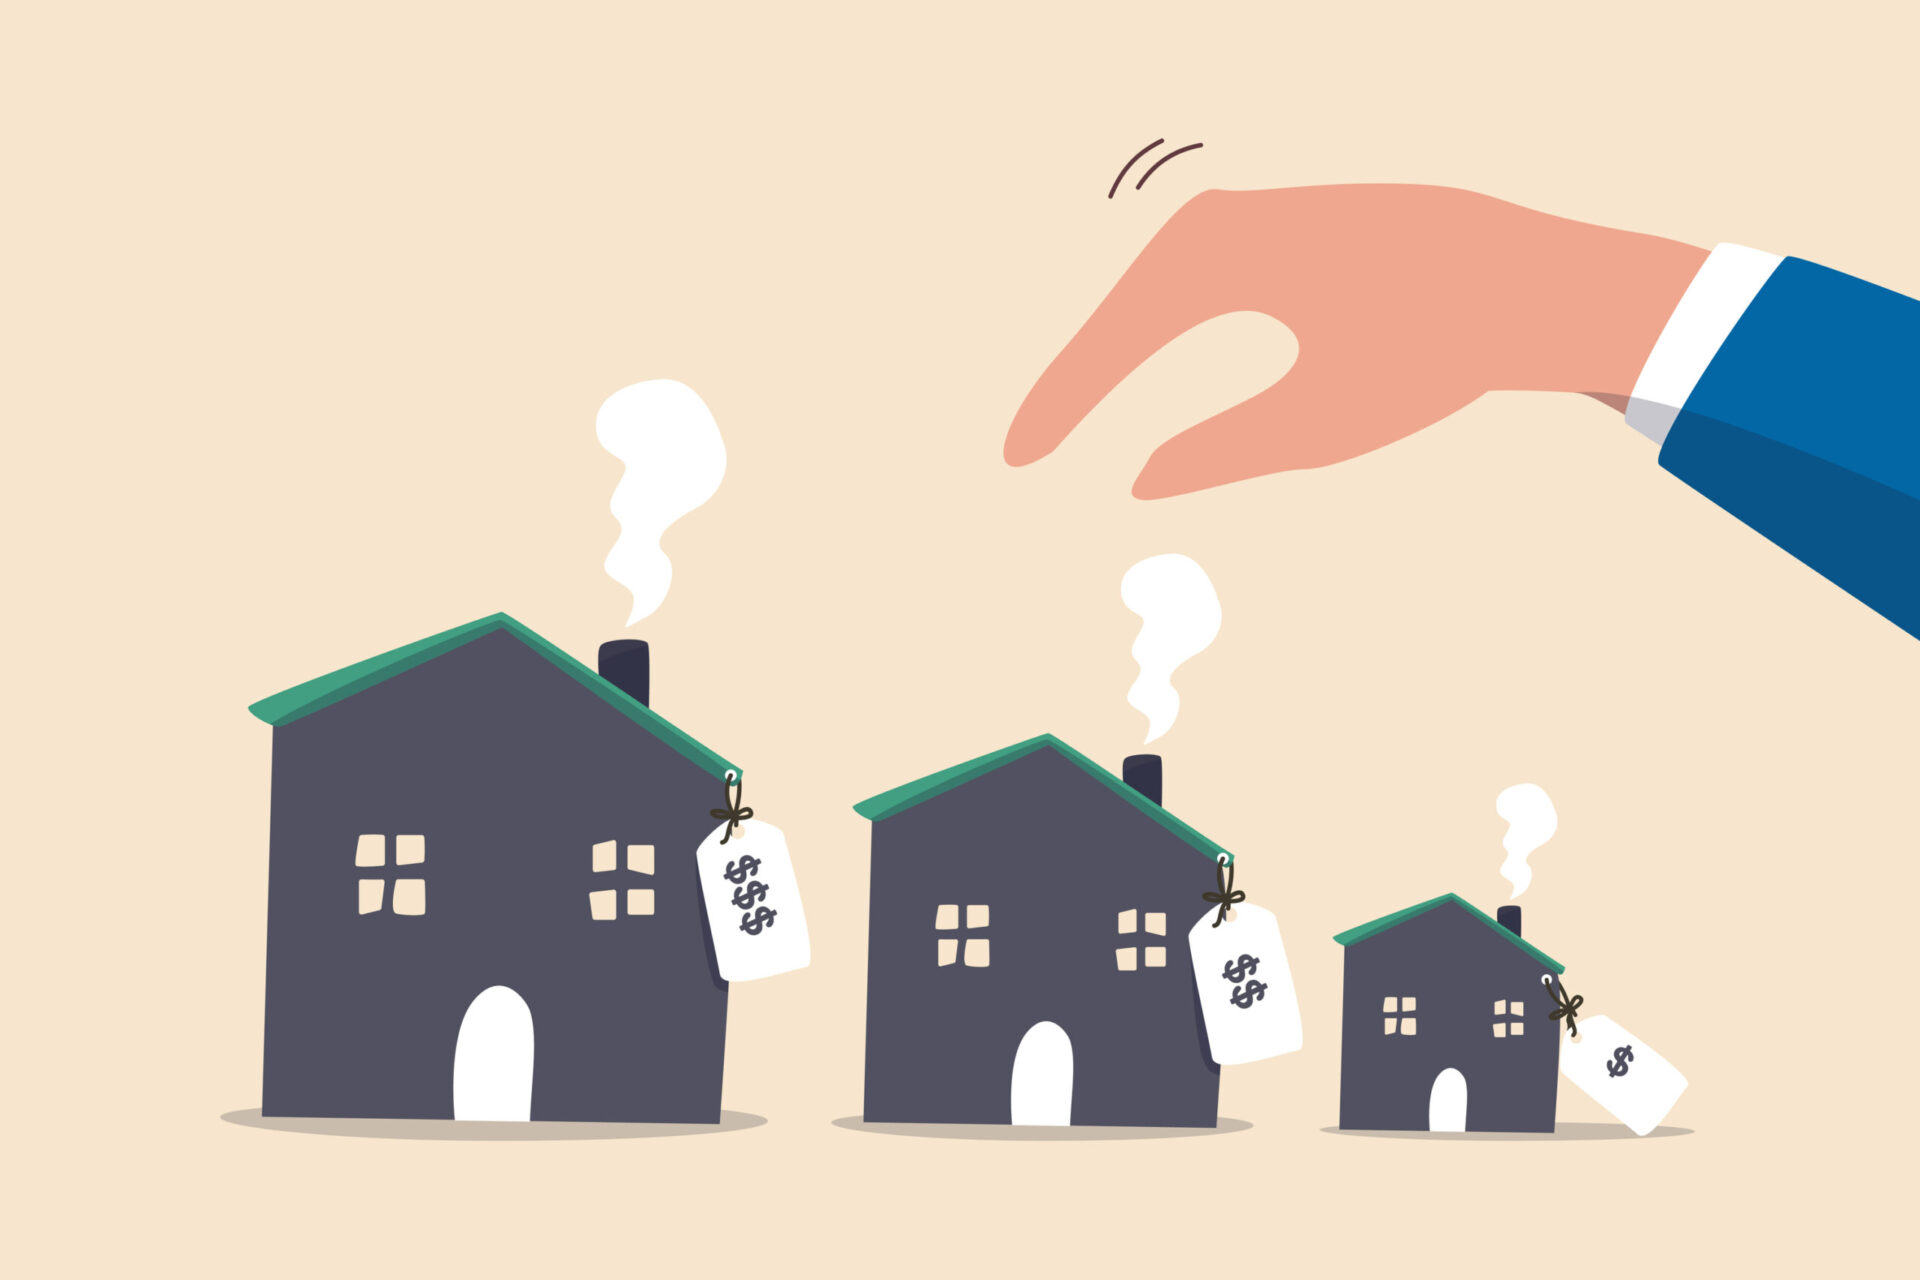
The value of a typical American home dropped for the second straight month, down 0.3% from July to August in the largest monthly dip since 2011. Zillow’s latest market report found that affordability is directing market declines, with lower-priced homes staying hotly competitive while expensive markets see drastic declines. The U.S. typical home value is now $356,054. Areas that saw big gains during the pandemic are now susceptible to fast drops, losing their appreciation momentum from the Great Migration. Midwestern markets, which tend to be more affordable, remain hot, while Western markets are comparatively tanking. Volatile mortgage rates are impacting these areas as borrowers find it increasingly hard to even qualify for a loan, let alone house-hunt. “Substantial day-to-day and…
New home sales fell in July to a seasonally adjusted annual rate of 511,000, down 12.6% from June and 29.6% YOY, according to data from the U.S. Census Bureau and the Department of Housing and Urban Development. The massive dropoff can be attributed to the rising cost of buying a home. Home price appreciation and increasing interest rates are pricing potential buyers out of the market. Between rates and prices, the monthly mortgage payment on a typical US home is 62% higher than a year ago. Meanwhile, some sellers are opting not to put their homes up for sale, exacerbating the stock shortage and driving up competition. About half of all homeowners have a rate under 4% and are disinclined…
Pending home sales tumbled in June after a slight increase in May, falling 8.6% month-over-month and 20% YOY. The National Association of Realtors’ Pending Home Sales Index posted a reading of 91 last month. A reading of 100 is equal to the level of contract activity in 2001. The PSHI is a forward-looking indicator of home sales based on contract signings. “Contract signings to buy a home will keep tumbling down as long as mortgage rates keep climbing, as has happened this year to date,” said NAR Chief Economist Lawrence Yun. “There are indications that mortgage rates may be topping or very close to a cyclical high in July. If so, pending contracts should also begin to stabilize.” Buying a…
Housing affordability fell across the country in May, with the monthly mortgage payment up 6.2% month-over-month and 51% year-over-year. The National Association of Realtor’s (NAR) Housing Affordability Index showed that in contrast to rapidly rising prices, the median family increase rose only 0.7% from April and 4.5% YOY. Housing affordability fell the most in the South, which saw a 33.8% decline, followed by the West (30%), the Midwest (27.6%), and the Northeast (25%). All of NAR’s Indices but the West posted readings above 100, meaning a family with the median income had more than the income required to afford a median-priced home. The Midwest was the most affordable region, with a reading of 140.5. The South was the second most…
Home price growth saw its largest single-month slowdown since 2006 in May as inventory begins to correct, according to Black Knight’s May Mortgage Monitor Report. May was the second straight month of prices cooling across the country. Home price growth slowed in 97 of the U.S.’s 100 largest housing markets. The national appreciation rate fell by more than a whole point YOY. “[W]hile any talk of home values and 2006 might set off alarm bells for some, the truth is that price gains would need to see deceleration at this rate for more than 12 months just to get us back to a ‘normal’ 3-5% annual growth rate,” said Black Knight Data & Analytics President Ben Graboske. “That said, the…
By CHUCK GREEN With lumber prices toppling, it might be the ideal time to knock on wood. Gently, though. It just might be a bit fragile at the moment. Year to date, prices have sagged around 50%, according to 7seasgroupusa.com. They recently sunk to their lowest point in nine months as they traded under the $600-per-thousand-board-feet mark. Conversely, a year ago, prices, fueled by pent-up demand for construction and home upgrades in the aftermath of COVID on the heels of a frenzy of speculation, reached $1,733, which was unprecedented.But as the housing market backed down in light of escalating interest rates, lumber prices have borne the brunt, receding more than 60% from their March highs, according to Business Insider. In May,…
Soaring interest rates pushed homebuyer demand down in its largest annual decline in more than two years, Redfin reported. Redfin’s Homebuyer Demand Index was down 16% YOY, its largest drop since April 2020, in response to lagging inventory and skyrocketing mortgage rates. Last week, rates jumped a full half-point in the largest one-week increase in the history of Freddie Mac’s weekly rate survey, which dates back to 1987. This week they’re up to 5.81%. At the same time, pending home sales were down 10% YOY, the largest decline since May 2020. Home prices are moderating slightly, but still elevated. The average size of a purchase loan application was $420,000, down from a peak of $460,000. In 2019, the average loan…
Affordability is at a 15-year low, with mortgage payments up in 45 of the 50 largest U.S. metros, according to Zillow’s latest market report. Buying a typical U.S. home with interest rates of 5.78% would result in monthly payments of $2,127. That’s up 36% year to date, and 51% YOY. Those monthly payments would account for 28% of homeowners’ monthly income, inching closer to the 30% benchmark that means homeowners are cost-burdened. The report noted that since rates have risen above the April data it references, homeowners may already be at that 30% threshold. Rising interest rates and soaring home prices have pushed mortgages out of reach for many Americans, leading to diminishing demand that has economists worried that recession…
Bidding wars dropped to their lowest level since February 2021 as the housing market begins to cool, with only 57.8% of home offers facing competition in May, according to Redfin. Though more than half of prospective buyers are still facing competition when bidding on a home, that number is down from 60.9% the month prior and a pandemic peak of 68.8% a year earlier. A typical home received 5.3 offers in May, down from 6.8 in April and 7.4 in YOY. This is the fourth straight month of declines. The unadjusted bidding war rate was 60.8%, down from 67.8% month-over-month and 71.8% YOY. “Homes are now getting one to three offers, compared with five to 10 two months ago and…