Homes are less affordable than they were a year ago, but they largely remain more affordable than at the peak of the 2006 housing boom, according to First American Financial Corporation’s Real House Price Index. In January, the RHPI rose 27% from the year prior, making it the fastest-growing RHPI – and fastest YOY decline in affordability – since 2004. This was driven by a 21.7% increase in home prices and a 0.7% rise in rates. The RHPI measures price changes for single-family properties adjusted for the impact of income and interest rate changes on consumer house-buying power. As such, it also serves as a measure of affordability. Household income was up 5% from January 2021, but that gain was…
Condo prices hit a record high– $319,000, up 14.6% YOY and 22.7% from before the pandemic— as buyers priced out of the single-family market turn towards more affordable options, Redfin reported. This is a turn-around from the beginning of the pandemic when American buyers wanted to avoid crowded areas, causing condo sales to drop by 48%. But as pandemic fears subside and home shoppers face stock shortages and price appreciation in the single-family market, condos are making a comeback. Gen Z in particular is reviving urban hotspots assumed to be dying out due to Covid-19. “Big cities are appealing for a host of reasons—big cities offer diverse job opportunities. Big cities offer many amenities that are not available in smaller…
Home prices grew by 19.1% annually in January 2022 and were up 1.4% from December 2021, according to CoreLogic’s Home Price Index (HPI) and HPI Forecast. The index found that annual appreciation of detached properties was 20.3%, 5.1 percentage points higher than that of attached properties, which saw a 15.2% increase. Naples and Punta Gorda, Florida, had the highest YOY home price growth for the second month straight, at 38.9% and 38.3%, respectively. The Mountain West and Southern regions dominated price growth nationally. Arizona took the number one spot with gains of 28.3%, followed by Florida (27.9%), and Utah (25.2%). But CoreLogic predicts that appreciation will slow to 3.8% annually by January 2023. “In December and January, for-sale inventory continued…
“Million-dollar cities” skyrocketed in 2021, with typical home values reaching at least $1 million in a record 146 new U.S. cities. Zillow found there are now 481 cities where the average home is worth $1 million or more, and an additional 49 cities could make the list by mid-2022 if home appreciation continues at its current rate. Typical home values jumped 19.6% in 2021 as homebuyers faced severe stock shortages, causing bidding wars that pushed prices up. Homeowners gained $2.6 trillion in tappable equity in 2021, up by 35% YOY for an aggregate total of almost $10 trillion. In Q4 2021 alone, tappable equity rose by nearly half a billion dollars. “Home price appreciation over the course of 2021 was…
Home prices rose year-over-year (YOY) by 18.5% across the nation in December 2021, and by 1.3% from November, CoreLogic’s latest Home Price Index reported. Home price growth averaged 15% for 2021, which saw one of the hottest housing markets in decades. Q1 2021 started off with 10% appreciation but continued to grow, reaching 18% in Q4. By comparison, price appreciation for the full year of 2020 averaged only 6%. The states with the highest increases YOY were Arizona (28.4%), Florida (27.1%), and Utah (25.2%). The cities with the biggest gains were Phoenix (30.2%), Las Vegas (24.4%), and San Diego (22.4%). CoreLogic predicts that home prices will remain flat this month and rise by only 3.5% by next December. Comparing annual…
Home prices across the country rose 1.1% month-over-month in November and 17.5% year-over-year, according to the latest Federal Housing Finance Agency House Price Index (FHFA HPI®). For the nine census divisions, seasonally adjusted monthly house price changes ranged from +0.5 percent in the West North Central division to +1.9 percent in the South Atlantic division. The 12-month changes ranged from +13.3 percent in the West North Central division to +22.8 percent in the Mountain division. “House price levels remained elevated in November, but the data indicate a pivot,” said Will Doerner, Ph.D., Supervisory Economist in FHFA’s Division of Research and Statistics. “The last four months reflect average gains of 1.0 percentage point, down from the larger prior changes during the…
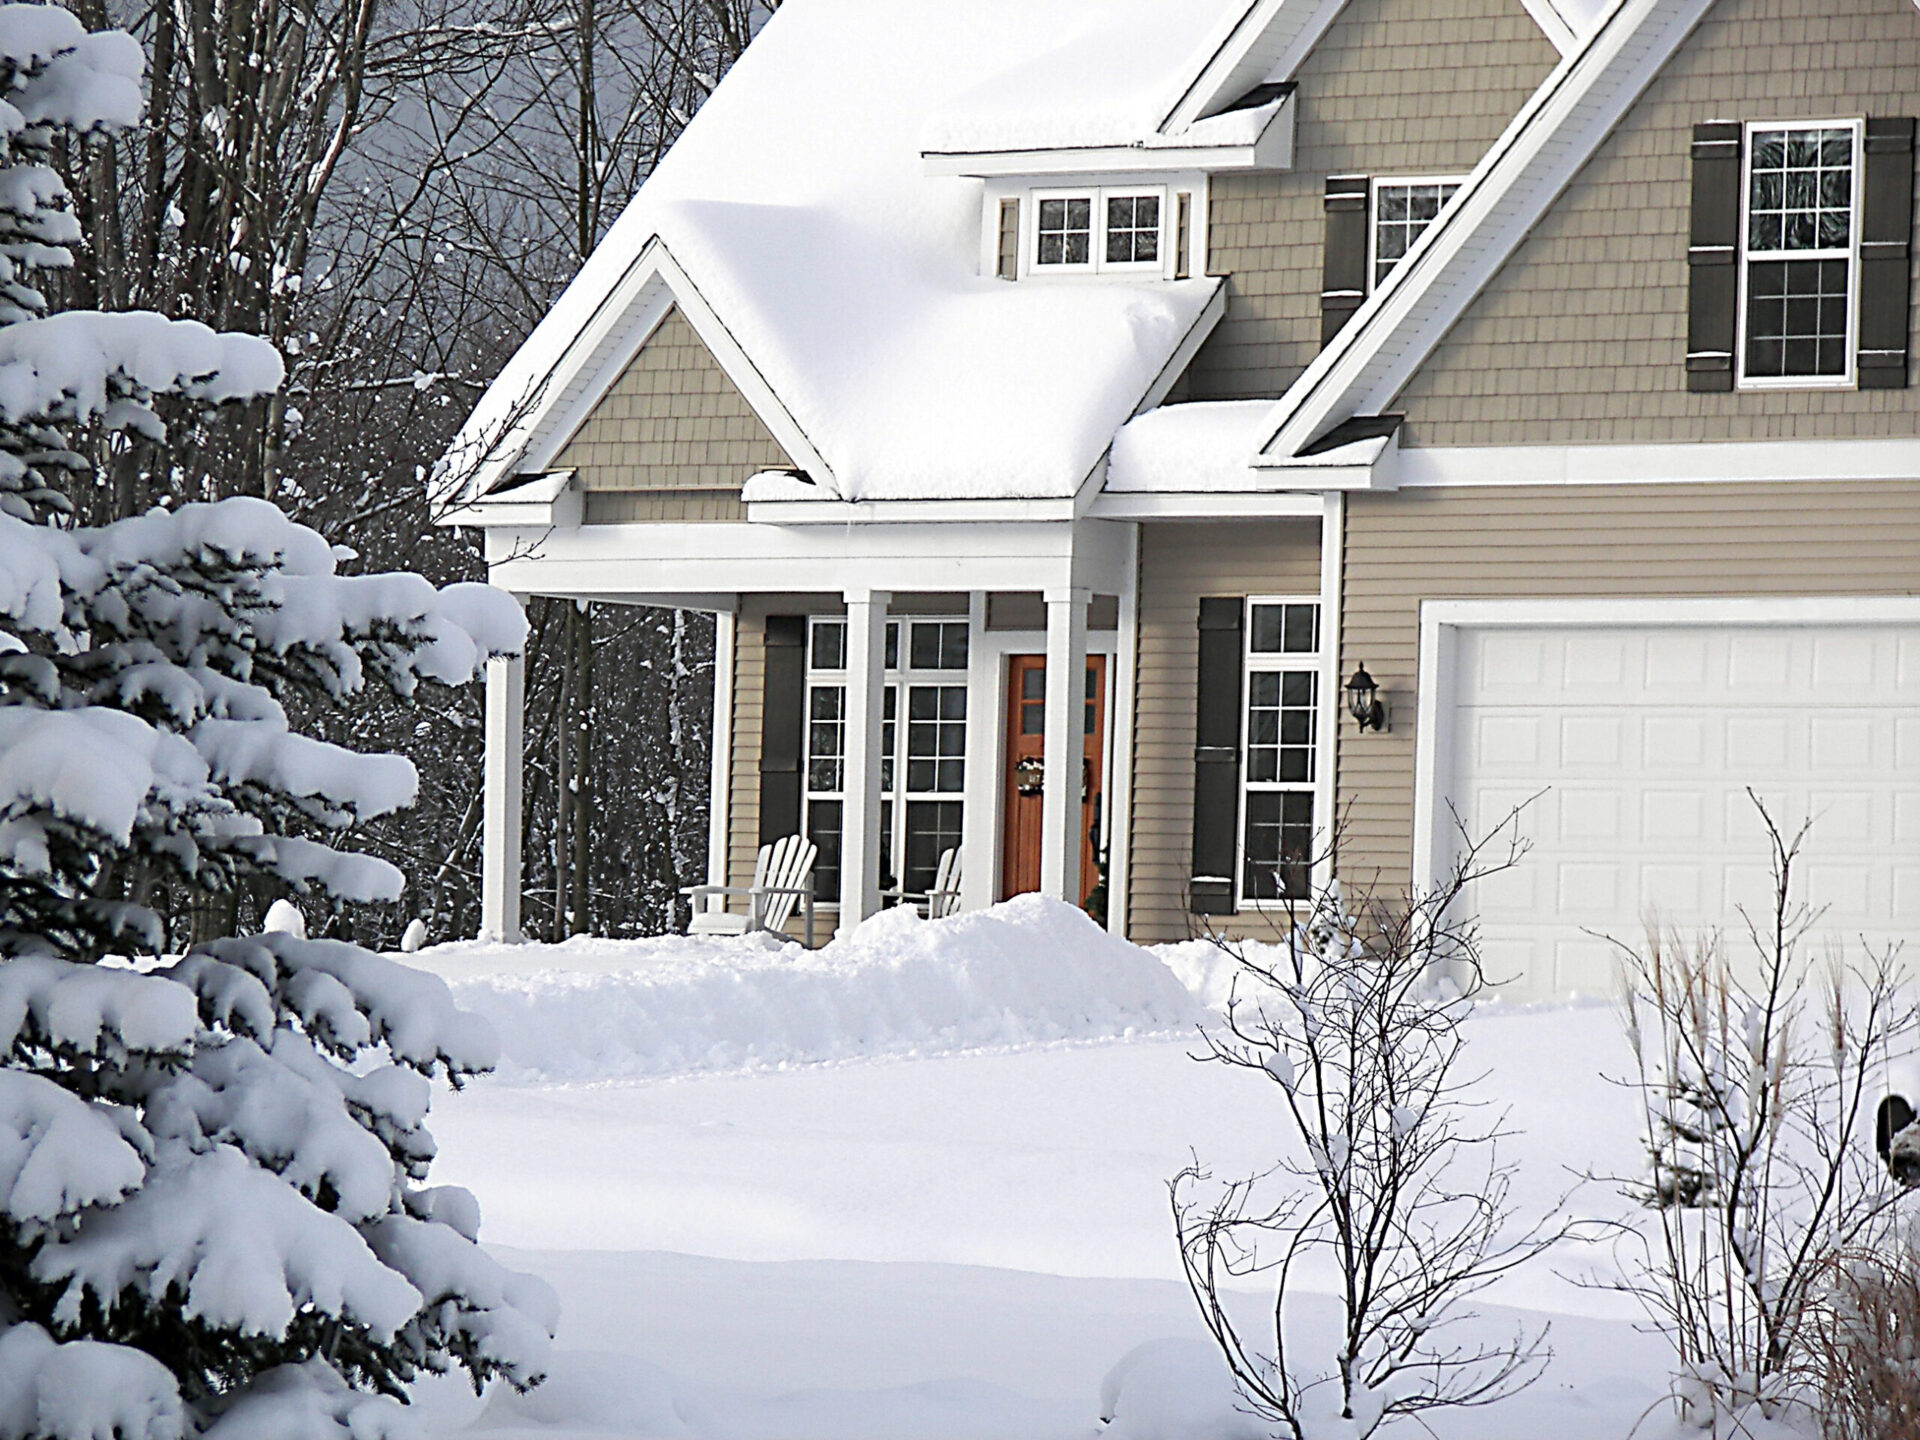
Monthly home value appreciation accelerated for the first time since July as potential buyers continue to outnumber new listings, driving December inventory to an all-time low, according to Zillow’s latest market report. “Home shoppers picked the shelves clean this December, leaving fewer active listings than ever before in the U.S. housing market,” said Jeff Tucker, senior economist at Zillow. “Enough determined buyers kept up their house hunt to reignite monthly price appreciation. Rising mortgage rates could be the next potential headwind, but demand has proven persistent; neither high prices nor slim inventories have deterred buyers so far.” The typical home value is now $320,662, 19.6% above that of December 2020 and a record high for Zillow’s data, which dates back…
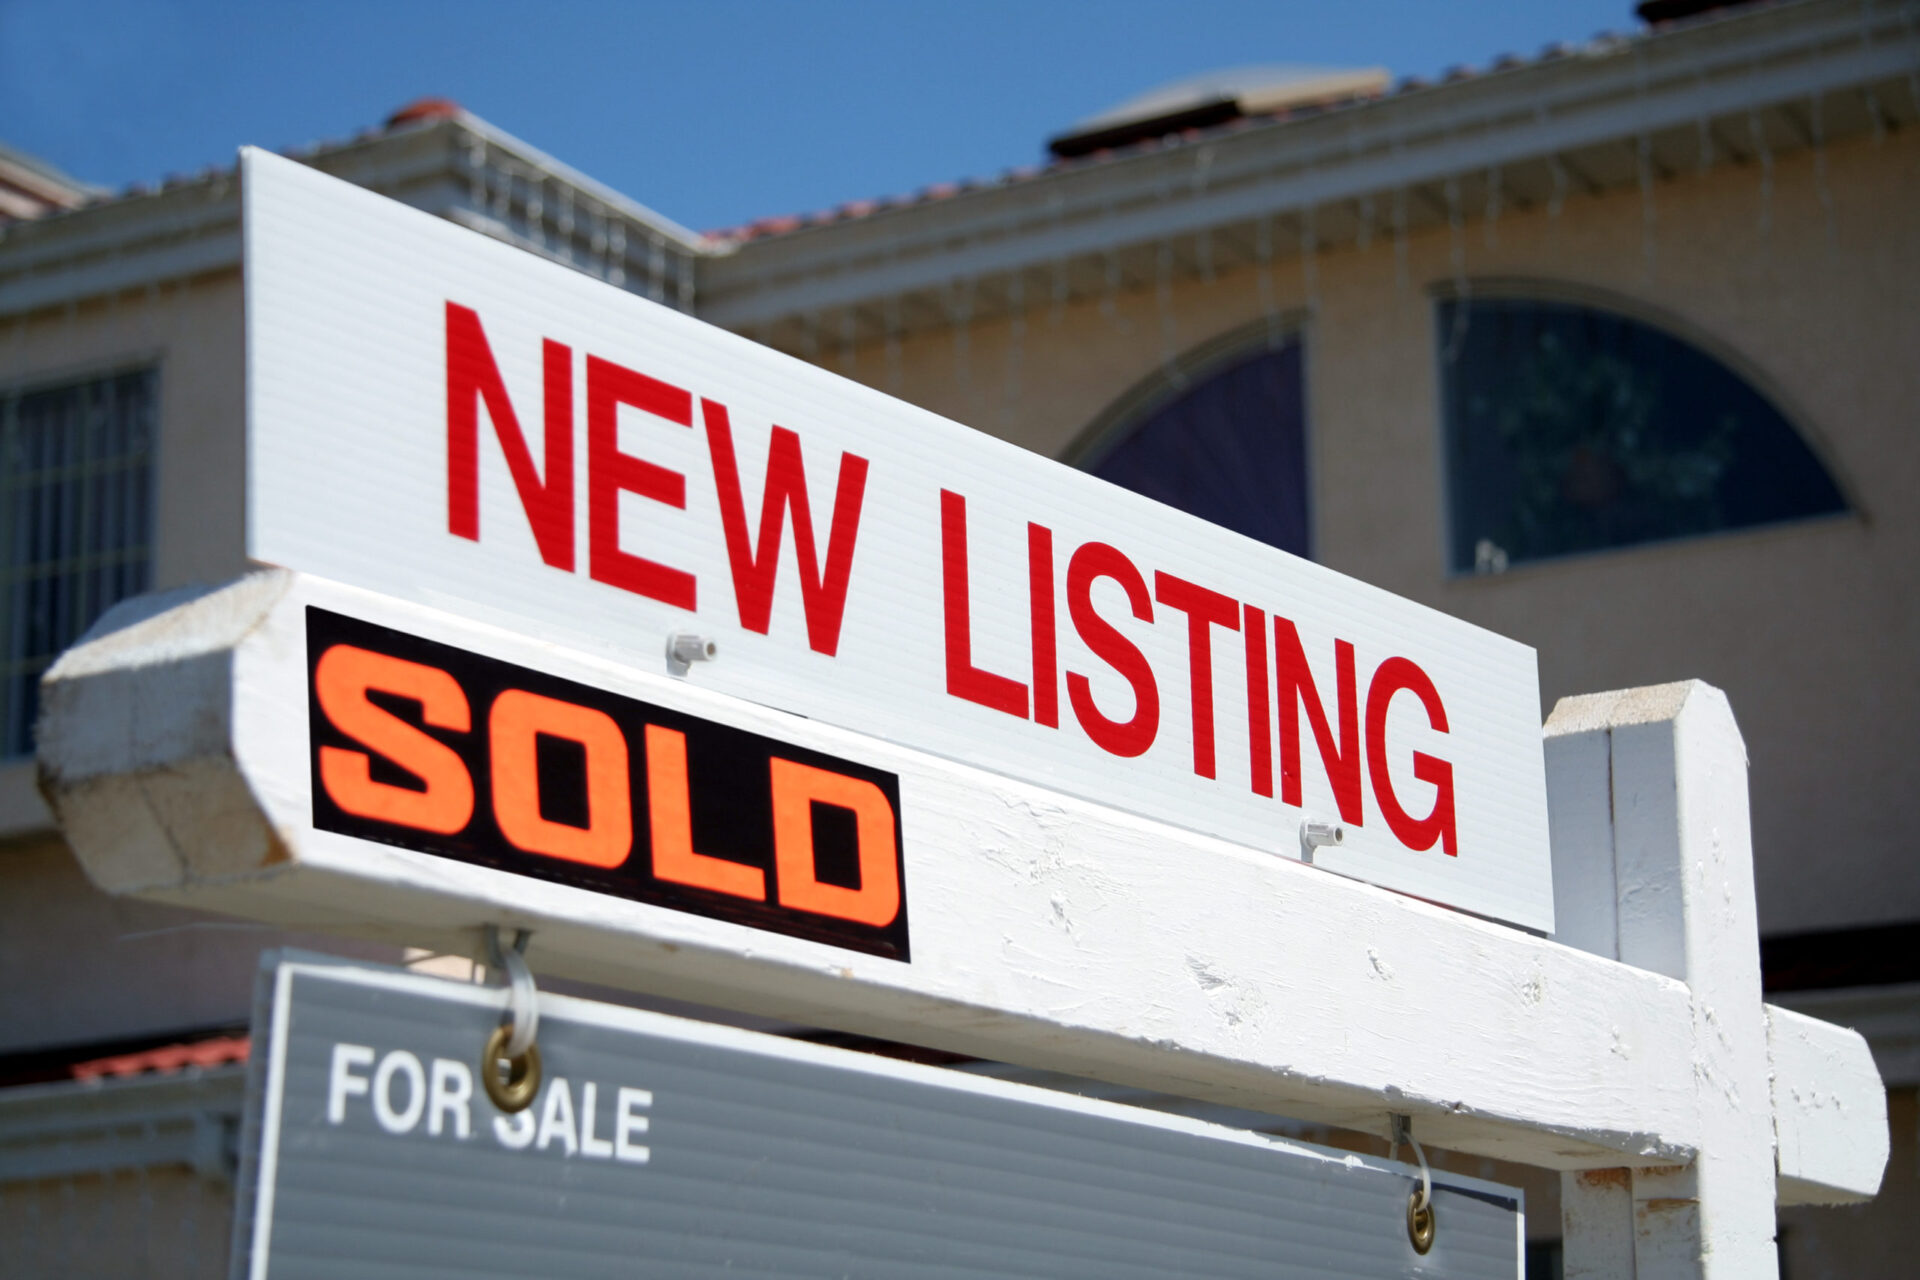
December was a hot month for homebuyers, but supply couldn’t keep up with demand. Monthly home sales saw their largest decline since the beginning of the pandemic, according to Redfin. Month-over-month sales fell 3.6%, the largest drop since May 2020, and were down 11% year-over-year (YOY), the largest annual decline since June 2020. The drop was the result of continuing stock shortages. Active listings declined 19% YOY, reaching a record low. New listings dropped 13%, down annually in 82 of the 88 metro areas Redfin tracks. In addition, home prices were up 15% YOY, marking the 17th straight month of double-digit price increases. “Home sales are slumping, but not for lack of demand,” said Redfin Chief Economist Daryl Fairweather. “There…
America’s home affordability problem was bad in 2020, before COVID-19 hit. In 2021, it got even worse. In Q4 2021, median-priced single-family homes were less affordable in 77% of U.S. counties analyzed by ATTOM Data Solutions, a 13-year high, the company found. In 440 out of the 575 counties analyzed, the gap between incomes and affordable home prices was larger than their historical averages. This is a dramatic increase from Q4 2020 when only 39% of counties were less affordable than in the past. “The average wage earner can still afford the typical home across the United States, but the financial comfort zone continues shrinking as home prices keep soaring and mortgage rates tick upward,” said Todd Teta, chief product…
Rate lock volume fell 4.7% month-over-month in November, Black Knight’s latest Originations Market Monitor report found. It is the third straight month of overall declines. The drop was driven by rate/term refinance originations, which fell 9.4% from October and almost 65% year-over-year (YOY), its lowest level since February 2020. Rate/term refinance dropped in eight out of eleven months in 2021. Locks on purchase and cash-out refinance fell 3.9% and 2.5% from October, respectively. However, they are still higher than 2020, with purchase locks up 13% YOY and cash-outs up 36% YOY. “While 30-year rates ended November relatively flat from where they were at the start of the month, there was some volatility in rate offerings throughout the month,” said Black…