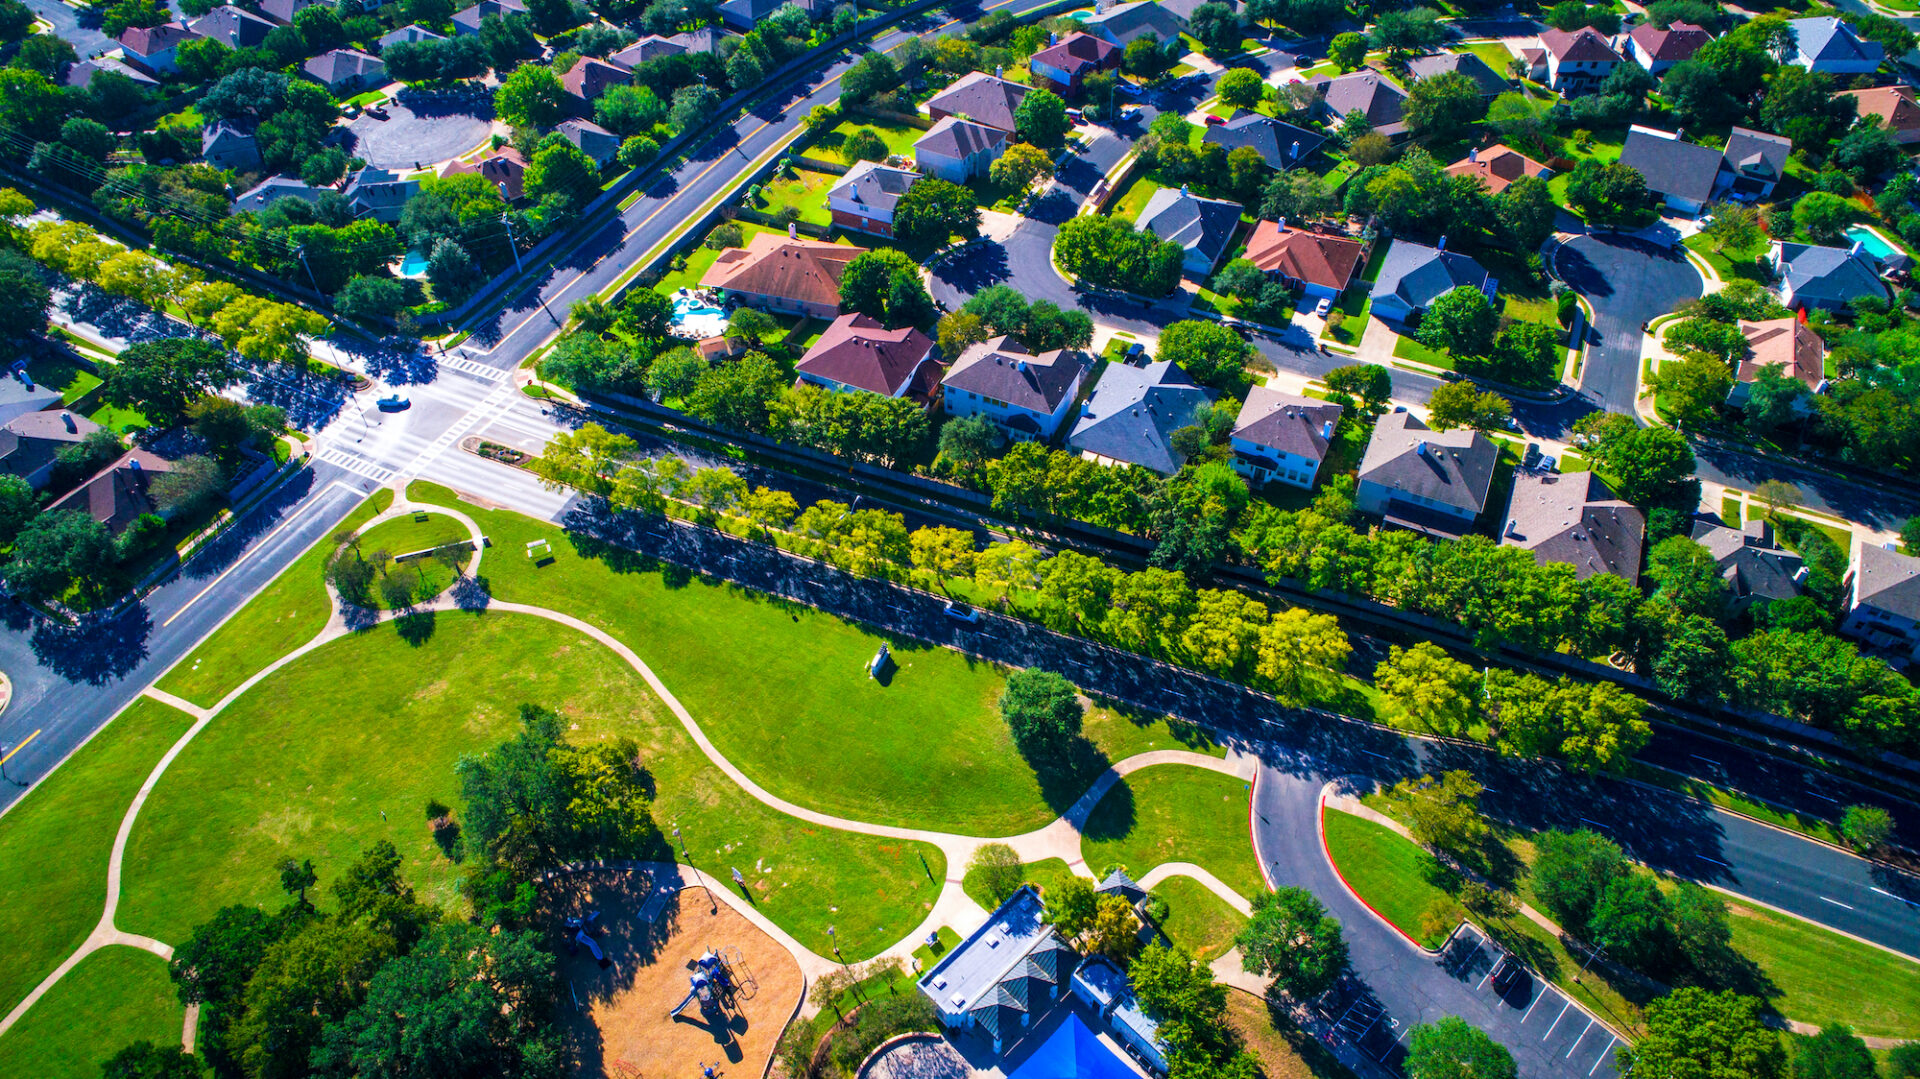
The Great Re-Suburbanization of America is underway.
“In one of the most seismic shifts to the U.S. workforce since the introduction of the Internet, many U.S. workers now have the flexibility to work remotely and choose where they want to live,” realtor.com Chief Economist Danielle Hale said. “Data shows in our post-COVID world there’s a strong preference towards a suburban lifestyle with its bigger houses, backyards, and quiet streets. But American cities are not becoming ghost towns anytime soon; in fact, they are also seeing an uptick of homebuyers. It’s just not as strong as the surge we’re seeing in the suburbs.”
New data from realtor.com shows that Americans are looking for more space and affordable homes in the suburbs. The report shows that suburban and urban areas recovered rapidly from the pandemic shutdown, but suburban markets have experienced more interest from home shoppers, stronger improvement of price growth, and quicker home sales than urban areas this summer.
Findings include:
- Suburban prices have accelerated 3.2 percent since the first week of March, compared to an acceleration of only 2.3 percent for urban areas.
- During the shutdown, suburban homes spent only 28.5 percent more time on the market in early May compared to last year, while urban homes spent 34.1 percent more time on the market compared to last year.
- Post shutdown, properties began to sell at an unprecedented fast-pace in both suburban (11.4 percent faster than last year) and urban areas (8 percent faster than last year).
- The number of homes for sale is down 41.3 percent compared to last year in suburban areas, while urban homes for sale are down 34.3 percent. This divergence in available homes began in early April, during the peak of the COVID-19 shutdowns, and has continued to accelerate since.
“Based on the rising popularity of the burbs, some buyers might think they can catch a break by searching in the city, but unfortunately that’s not the case. Rising home prices and fast home sales are everywhere. If you’re a buyer in today’s market, finding and closing on your dream home is not going to be easy,” Hale said.
Here’s how it looks in select markets:
| Metro | Listing Price Growth Y/Y | Time Spent on Market Y/Y | Inventory Growth Y/Y |
| U.S. | Urban: 7.7% Sub: 7.3% | Urban: -8.0% Sub: -11.4% | Urban: -34.3% Sub: -41.2% |
| New York-Newark-Jersey City, N.Y.-N.J.-Pa. | Urban: 2.1% Sub: 5.6% | Urban: -27.3% Sub: -26.9% | Urban: 18.6% Sub: -28.0% |
| Los Angeles-Long Beach-Anaheim, Calif. | Urban: 3.0% Sub: 4.4% | Urban: 31.8% Sub: -0.8% | Urban: 14.4% Sub: -36.1% |
| Chicago-Naperville-Elgin, Ill.-Ind.-Wis. | Urban: 0.2% Sub: 2.4% | Urban: -11.9% Sub: -6.2% | Urban: -29.2% Sub: -42.8% |
| Dallas-Fort Worth-Arlington, Texas | Urban: 4.5% Sub: 5.6% | Urban: -11.7% Sub: -6.5% | Urban: -37.7% Sub: -41.9% |
| Houston-The Woodlands-Sugar Land, Texas | Urban: 4.8% Sub: 4.2% | Urban: -4.4% Sub: -3.4% | Urban: -12.3% Sub: -36.2% |
| Philadelphia-Camden-Wilmington, Pa.-N.J.-Del.-Md. | Urban: 10.4% Sub: 9.8% | Urban: -24.2% Sub: -35.1% | Urban: -42.6% Sub: -50.2% |
| Washington-Arlington-Alexandria, DC-Va.-Md.-W. Va. | Urban: 0.4% Sub: 4.7% | Urban: -27.9% Sub: -36.4% | Urban: -16.0% Sub: -53.6% |
| Miami-Fort Lauderdale-West Palm Beach, Fla. | Urban: -2.2% Sub: 0.3% | Urban: 4.5% Sub: -5.9% | Urban: -3.9% Sub: -20.6% |
| Atlanta-Sandy Springs-Roswell, Ga. | Urban: 5.0% Sub: 8.5% | Urban: -1.3% Sub: -7.8% | Urban: -28.9% Sub: -48.4% |
| Boston-Cambridge-Newton, Mass.-N.H. | Urban: -0.4% Sub: 6.0% | Urban: -32.1% Sub: -32.8% | Urban: 4.0% Sub: -43.7% |
