By Jim Perskie
More than 50 years after redlining was outlawed, the practice still has a profound impact on the wealth and property values in neighborhoods across the country, according to a report released by Redfin on Thursday.
The typical homeowner in a neighborhood that was “redlined” for mortgage lending by the federal government has gained 52 percent less – or $212,023 – in personal wealth generated by property value increases than those in greenlined neighborhoods over the last 40 years.
“More than half a century after it was abolished, redlining continues to dictate the racial makeup of neighborhoods and Black families still feel the socioeconomic effects of such a discriminatory housing policy,” Redfin chief economist Daryl Fairweather said.
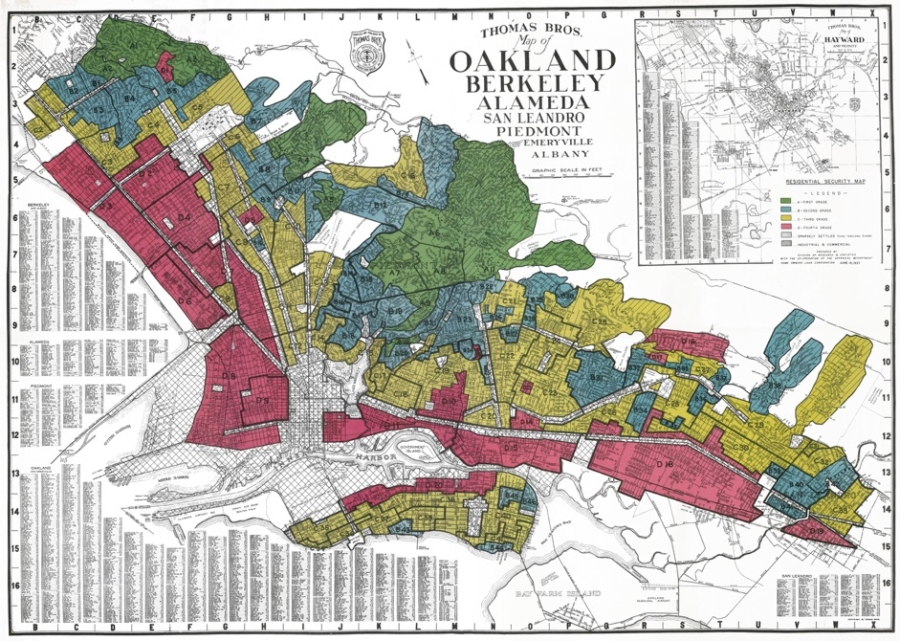
Redlining is the practice of denying mortgages – or other goods or services – to whole neighborhoods on the basis of race or ethnicity. The Fair Housing Act of 1968 was passed to fight redlining.
The Redfin study found that black homeowners are nearly five times more likely to own in a formerly redlined neighborhood than in a greenlined neighborhood, resulting in diminished home equity and overall economic inequality for black families.
Redlining effectively blocked black families from obtaining loans by assigning low mortgage security ratings to predominantly black neighborhoods – contributing to the wealth and homeownership rates between black and white families that persist event today.
The national homeownership rate for white families is 73.7 percent, while it is 44 percent for black families.
“Black families who were unable to secure housing loans in the neighborhoods where they lived have missed out on one of the major ways to build wealth in this country,” Fairweather said. “And even families who were able to buy homes in their neighborhood after redlining ended haven’t earned nearly as much home equity as people who bought homes in neighborhoods that were considered more valuable.”
Redlining’s Legacy
In 2017, homeownership rates are lowest for white and black families in former redlined neighborhoods – and home equity is greater in former greenlined neighborhoods in 40 of 41 metropolitan areas in the analysis (all but Philadelphia).
| Medium Home Equity in 1975-1980 (in today’s dollars) | Medium Home Equity in 2019 | Home Equity Growth ($) | Home Equity Growth (%) | Total Home Equity Growth ($) | Total Homes Sold | |
| Type A/Best | $200,122 | $608,195 | $408,073 | 204% | $18.9b | 32,845 |
| Type B/Still Desirable | $129,195 | $428,634 | $299,439 | 232% | $47.6b | 101,436 |
| Type C/Definitely Declining | $93,732 | $312,707 | $218,976 | 234% | $62.1b | 160,964 |
| Type D/Hazardous | $67,100 | $263,150 | $196,050 | 292% | $22.5b | 61,922 |
The starkest example of the imbalance is in Warren, Michigan, where in 2019 the typical homeowner in the area rated “Type A” had 1,309 percent more home equity than one in a redlined area – $634,000 versus $45,000.
Conversely, New York City and San Jose both have relatively smaller gaps in home equity gains between former greenlined and redlined neighborhoods. Redfin concluded, “That’s likely because both are job centers with high wages and in-demand housing, and in each home prices have risen substantially in almost every neighborhood.”
Still, the black homeownership rate is just 32.4 percent in both New York and San Jose – well below the 44 percent nationwide.