
Home sales are expected to stay hot through the fall before easing back during 2021 – but stay above pre-pandemic levels, according to a new forecast from Zillow.
“Zillow’s predictions for seasonally adjusted home prices and pending sales are more optimistic than previous forecasts because sales and prices have stayed strong through the summer months amid increasingly short inventory and high demand,” Zillow forecasts. “The pandemic also pushed the buying season further back in the year, adding to recent sales. Future sources of uncertainty including lapsed fiscal relief, the long-term fate of policies supporting the rental and mortgage market, and virus-specific factors, were incorporated into this outlook. “
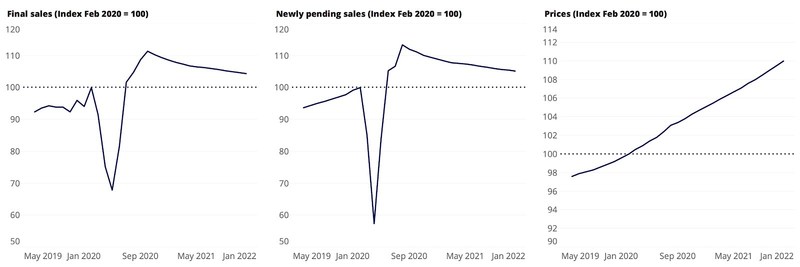
Zillow says seasonally adjusted home prices are expected to increase another 1.2 percent from August to November – and 4.8 percent between August 2020 and August 2021.
Here is how the market looked in select markets in August, according to Zillow:
| Metropolitan Area* | Newly Pending Sales – YoY | Median Days to Pending | Total For-Sale Listings – YoY | New For-Sale Listings – YoY | Median Sale Price** | Median Sale Price – YoY** |
| United States | 21.8% | 13 | -34.6% | -13.6% | 284000 | 8.7% |
| New York/Newark, NY/NJ | 60.4% | 32 | -20.1% | -11.5% | 445000 | 2.7% |
| Los Angeles, CA | 8.1% | 12 | -24.9% | 8.4% | 713375 | 7.7% |
| Chicago, IL | 38.2% | 13 | -28.5% | -1.0% | 264500 | 7.3% |
| Dallas-Fort Worth, TX | 30.6% | 23 | -31.8% | -24.4% | 303812 | 9.1% |
| Philadelphia, PA | 37.1% | 9 | -37.3% | -5.8% | 279000 | 5.3% |
| Houston, TX | 25.4% | 17 | -29.1% | -17.3% | 271529 | 9.9% |
| Washington, DC | 21.8% | 7 | -34.4% | -1.6% | 459431 | 8.4% |
| Miami-Fort Lauderdale, FL | 40.1% | 27 | -13.4% | -12.3% | 329750 | 12.4% |
| Atlanta, GA | 15.8% | 14 | -30.6% | -22.0% | 283850 | 10.4% |
| Boston, MA | 6.3% | 8 | -30.5% | -18.9% | 522500 | 8.1% |
| San Francisco, CA | 34.4% | 12 | -4.3% | 3.1% | 896500 | 12.1% |
| Detroit, MI | 41.8% | 8 | -38.1% | -14.9% | 222975 | 11.7% |
| Riverside, CA | 12.0% | 9 | -48.1% | 6.6% | 411250 | 10.3% |
| Phoenix, AZ | 18.9% | 11 | -21.6% | 0.0% | 322500 | 11.9% |
| Seattle, WA | 20.5% | 6 | -32.2% | -6.3% | 535525 | 11.1% |
| Minneapolis-St. Paul, MN | 31.2% | 17 | -27.1% | 3.9% | 311625 | 9.3% |
| San Diego, CA | 8 | -38.2% | 2.5% | 635188 | 8.9% | |
| St. Louis, MO | 16.8% | 6 | -38.4% | -11.2% | 217912 | 10.7% |
| Tampa, FL | 8 | -34.8% | -16.4% | 258409 | 9.5% | |
| Baltimore, MD | 17.2% | 12 | -44.8% | -12.7% | 317500 | 0.8% |
| Denver, CO | 25.8% | 6 | -34.2% | 16.2% | 462881 | 6.5% |
| Pittsburgh, PA | 52.3% | 9 | -27.2% | -2.3% | 199499 | 7.7% |
| Portland, OR | 21.9% | 6 | -37.0% | -28.4% | 440225 | 8.6% |
| Charlotte, NC | -1.8% | 6 | -42.9% | -19.2% | 286500 | 8.5% |
| Sacramento, CA | 18.3% | 7 | -44.1% | 0.3% | 452875 | 8.1% |
| San Antonio, TX | 34.4% | 27 | -25.7% | -23.1% | 252812 | 8.2% |
| Orlando, FL | 12 | -17.0% | -3.0% | 282562 | 7.8% | |
| Cincinnati, OH | 12.0% | 4 | -39.1% | -3.7% | 212125 | 11.8% |
| Cleveland, OH | 70.9% | 18 | -39.8% | -0.8% | 175350 | 9.6% |
| Kansas City, MO | 15.4% | 5 | -43.7% | -4.9% | 259250 | 12.7% |
| Las Vegas, NV | 18.5% | 15 | -23.3% | 8.3% | 304750 | -0.1% |
| Columbus, OH | 18.6% | 4 | -40.1% | -11.4% | 240500 | 16.1% |
| Indianapolis, IN | 14.0% | 5 | -41.0% | 6.7% | 222625 | 8.4% |
| San Jose, CA | -9.7% | 15 | -20.2% | 20.3% | 1139375 | 8.6% |
| Austin, TX | 29.2% | 8 | -37.0% | -2.9% | 357978 | 12.4% |
| Virginia Beach, VA | 32 | -40.7% | -1.3% | 276912 | 8.1% | |
| Nashville, TN | 33 | -24.0% | -36.9% | 317850 | 5.1% | |
| Providence, RI | -2.9% | 13 | -38.3% | -24.4% | 318600 | 5.4% |
| Milwaukee, WI | 28 | -6.5% | -6.2% | 207475 | 6.9% | |
| Jacksonville, FL | 43.2% | 14 | -36.7% | -17.0% | 268362 | 1.3% |
| Memphis, TN | 33.9% | 7 | -45.4% | -20.2% | 209212 | 7.0% |
| Oklahoma City, OK | 20.4% | 10 | -35.5% | -6.2% | 205750 | 12.5% |
| Louisville, KY | 3.0% | 5 | -43.9% | -8.3% | 217812 | 9.0% |
| Hartford, CT | 49.6% | 10 | -41.5% | 5.7% | 258800 | 7.8% |
| Richmond, VA | 6 | -39.9% | -10.0% | 284688 | 7.9% | |
| New Orleans, LA | 4.1% | 17 | -44.0% | -20.8% | 232875 | 6.6% |
| Buffalo, NY | 18.7% | 10 | -36.2% | -8.6% | 189850 | 9.7% |
| Raleigh, NC | 15.0% | 5 | -41.4% | -25.7% | 312812 | 5.8% |
| Birmingham, AL | 43.2% | 8 | -35.4% | 9.3% | 224942 | 4.8% |
| Salt Lake City, UT | 6 | -45.5% | -33.7% | 381916 | 11.2% |