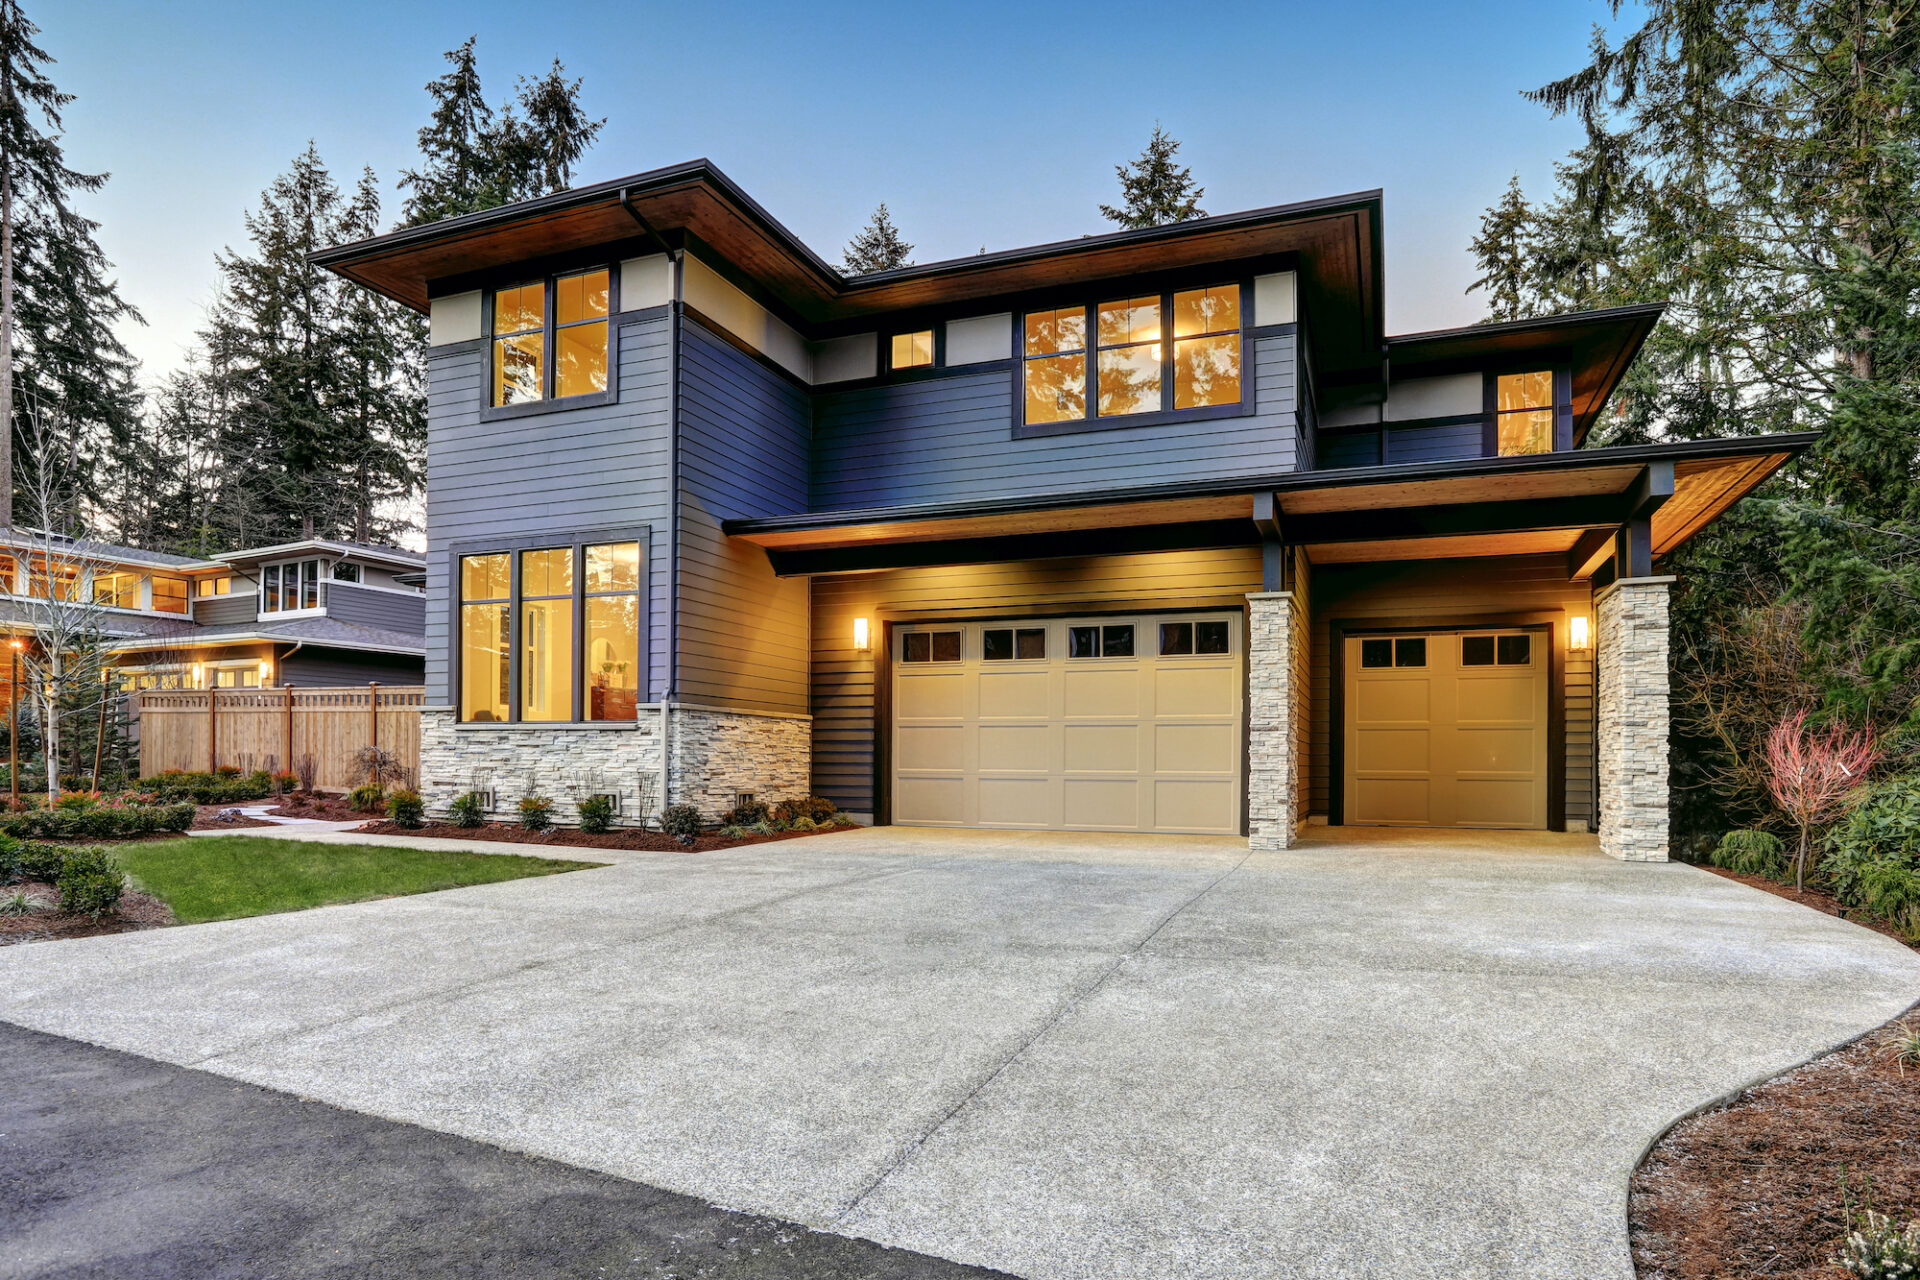
After cratering in April and May, new listings for high-end homes are making a comeback on the market this summer.
Listings for the most expensive homes dropped by about 50 percent at the height of the pandemic – but are now down just 9 percent from year, according to a new report released Wednesday by Zillow.
Listings for least expensive homes – which had dropped by about one-third this spring – remain 29 percent below last year’s level.
“The way unemployment has hit in this recession – with more layoffs in service, retail, food, entertainment, and other jobs unable to be done remotely – could result in vastly different experiences on either end of the housing price spectrum,” Zillow economist Jeff Tucker said.
In another report released Wednesday, Redfin said pending home sales decreased 8.2 percent year-over-year for the week ending June 28, a sharp change from the revised 3.9 percent year-over-year increase a week earlier. The decline in pending sales may be a sign that pent-up homebuyer demand from March and April has mostly worked its way through the market, but it could also be due to a continued shortage of homes for sale.
The change in listings has contributed to an increase in list prices. While list prices remained soft through May, Zillow’s most recent data shows median list price is starting to accelerate. Median list price is now at $337,160, a 0.6 percent increase from a week ago and 3.8 percent higher than this time last year.
“Millions of Americans who lost jobs or income are only able to stay in their homes right now thanks to extraordinary forbearance programs, which means they likely have to pause their plans to trade up or move to a new city. But for wealthier homeowners whose employment has remained stable and are looking to trade up, now may be an opportune time to sell and lock in a record-low mortgage rate on their dream home.”
Here is a look at markets across the country – comparing the number of listings for the top fifth most expensive homes and bottom fifth least expensive homes – as well as the change in list prices by market:
| Number Of Listings | June 2020 | |||
| Market | Top 5th Monthly Change | Bottom 5th Monthly Change | Median List Price | Change |
| United States | 8.4% | -9.3% | $337,160 | 2.9% |
| New York, NY | 14.8% | 12.5% | $599,200 | 0.3% |
| Los Angeles-Long Beach-Anaheim, CA | 1.5% | -2.4% | $912,515 | 4.2% |
| Chicago, IL | 45.9% | -5.5% | $343,776 | 2.8% |
| Dallas-Fort Worth, TX | 7.4% | -18.6% | $353,800 | 2.0% |
| Philadelphia, PA | 19.3% | -7.2% | $333,074 | 5.2% |
| Houston, TX | 7.3% | -10.7% | $332,454 | 2.2% |
| Washington, DC | 20.8% | -18.9% | $548,126 | 4.1% |
| Miami-Fort Lauderdale, FL | 13.7% | 7.0% | $398,980 | 0.8% |
| Atlanta, GA | 15.7% | -1.0% | $344,660 | 3.2% |
| Boston, MA | 2.8% | 5.4% | $638,202 | 3.4% |
| San Francisco, CA | 8.5% | 8.0% | $993,600 | 4.8% |
| Detroit, MI | 21.5% | 3.6% | $279,750 | 9.6% |
| Riverside, CA | -5.9% | -15.6% | $443,760 | 3.4% |
| Phoenix, AZ | 1.3% | -35.4% | $393,212 | 3.8% |
| Seattle, WA | 14.1% | -31.9% | $667,770 | 1.7% |
| Minneapolis-St Paul, MN | 10.4% | 15.3% | $381,140 | 0.6% |
| San Diego, CA | 14.4% | -21.7% | $800,580 | 5.3% |
| St. Louis, MO | 22.1% | -9.5% | $263,550 | 2.4% |
| Tampa, FL | 14.0% | -5.9% | $296,278 | 3.0% |
| Baltimore, MD | 11.0% | 4.5% | $367,760 | 2.9% |
| Denver, CO | 1.8% | -5.5% | $544,780 | 2.3% |
| Pittsburgh, PA | -15.6% | -40.8% | $222,740 | 8.2% |
| Portland, OR | 23.1% | -29.3% | $497,424 | 2.6% |
| Charlotte, NC | 16.3% | -13.3% | $372,800 | 3.4% |
| Sacramento, CA | 15.5% | 5.0% | $535,583 | 1.9% |
| San Antonio, TX | 18.3% | 1.5% | $299,515 | 2.3% |
| Orlando, FL | 25.6% | -7.6% | $323,798 | 1.9% |
| Cincinnati, OH | 24.0% | 19.2% | $335,920 | 5.0% |
| Cleveland, OH | 33.5% | -16.1% | $217,740 | 4.7% |
| Kansas City, MO | 1.9% | 6.4% | $369,680 | 2.7% |
| Las Vegas, NV | 14.9% | 18.4% | $333,244 | 2.0% |
| Columbus, OH | 7.8% | -7.4% | $348,976 | 4.2% |
| Indianapolis, IN | 40.5% | -39.5% | $315,549 | 5.1% |
| San Jose, CA | 0.3% | -6.3% | $1,217,778 | 2.8% |
| Austin, TX | -1.8% | -11.4% | $413,345 | 4.5% |
